The recommendation to close a building is based on a projected decline in elementary enrollment. However, based on the district’s records, the administration’s 5-year enrollment projections have understated actual enrollment by several hundred students.
The large discrepancy in projected enrollment v. actual enrollment for the last 3 years is a clear reason why no building in the district should be closed.
This information was obtained under the Right-to-Know Law:
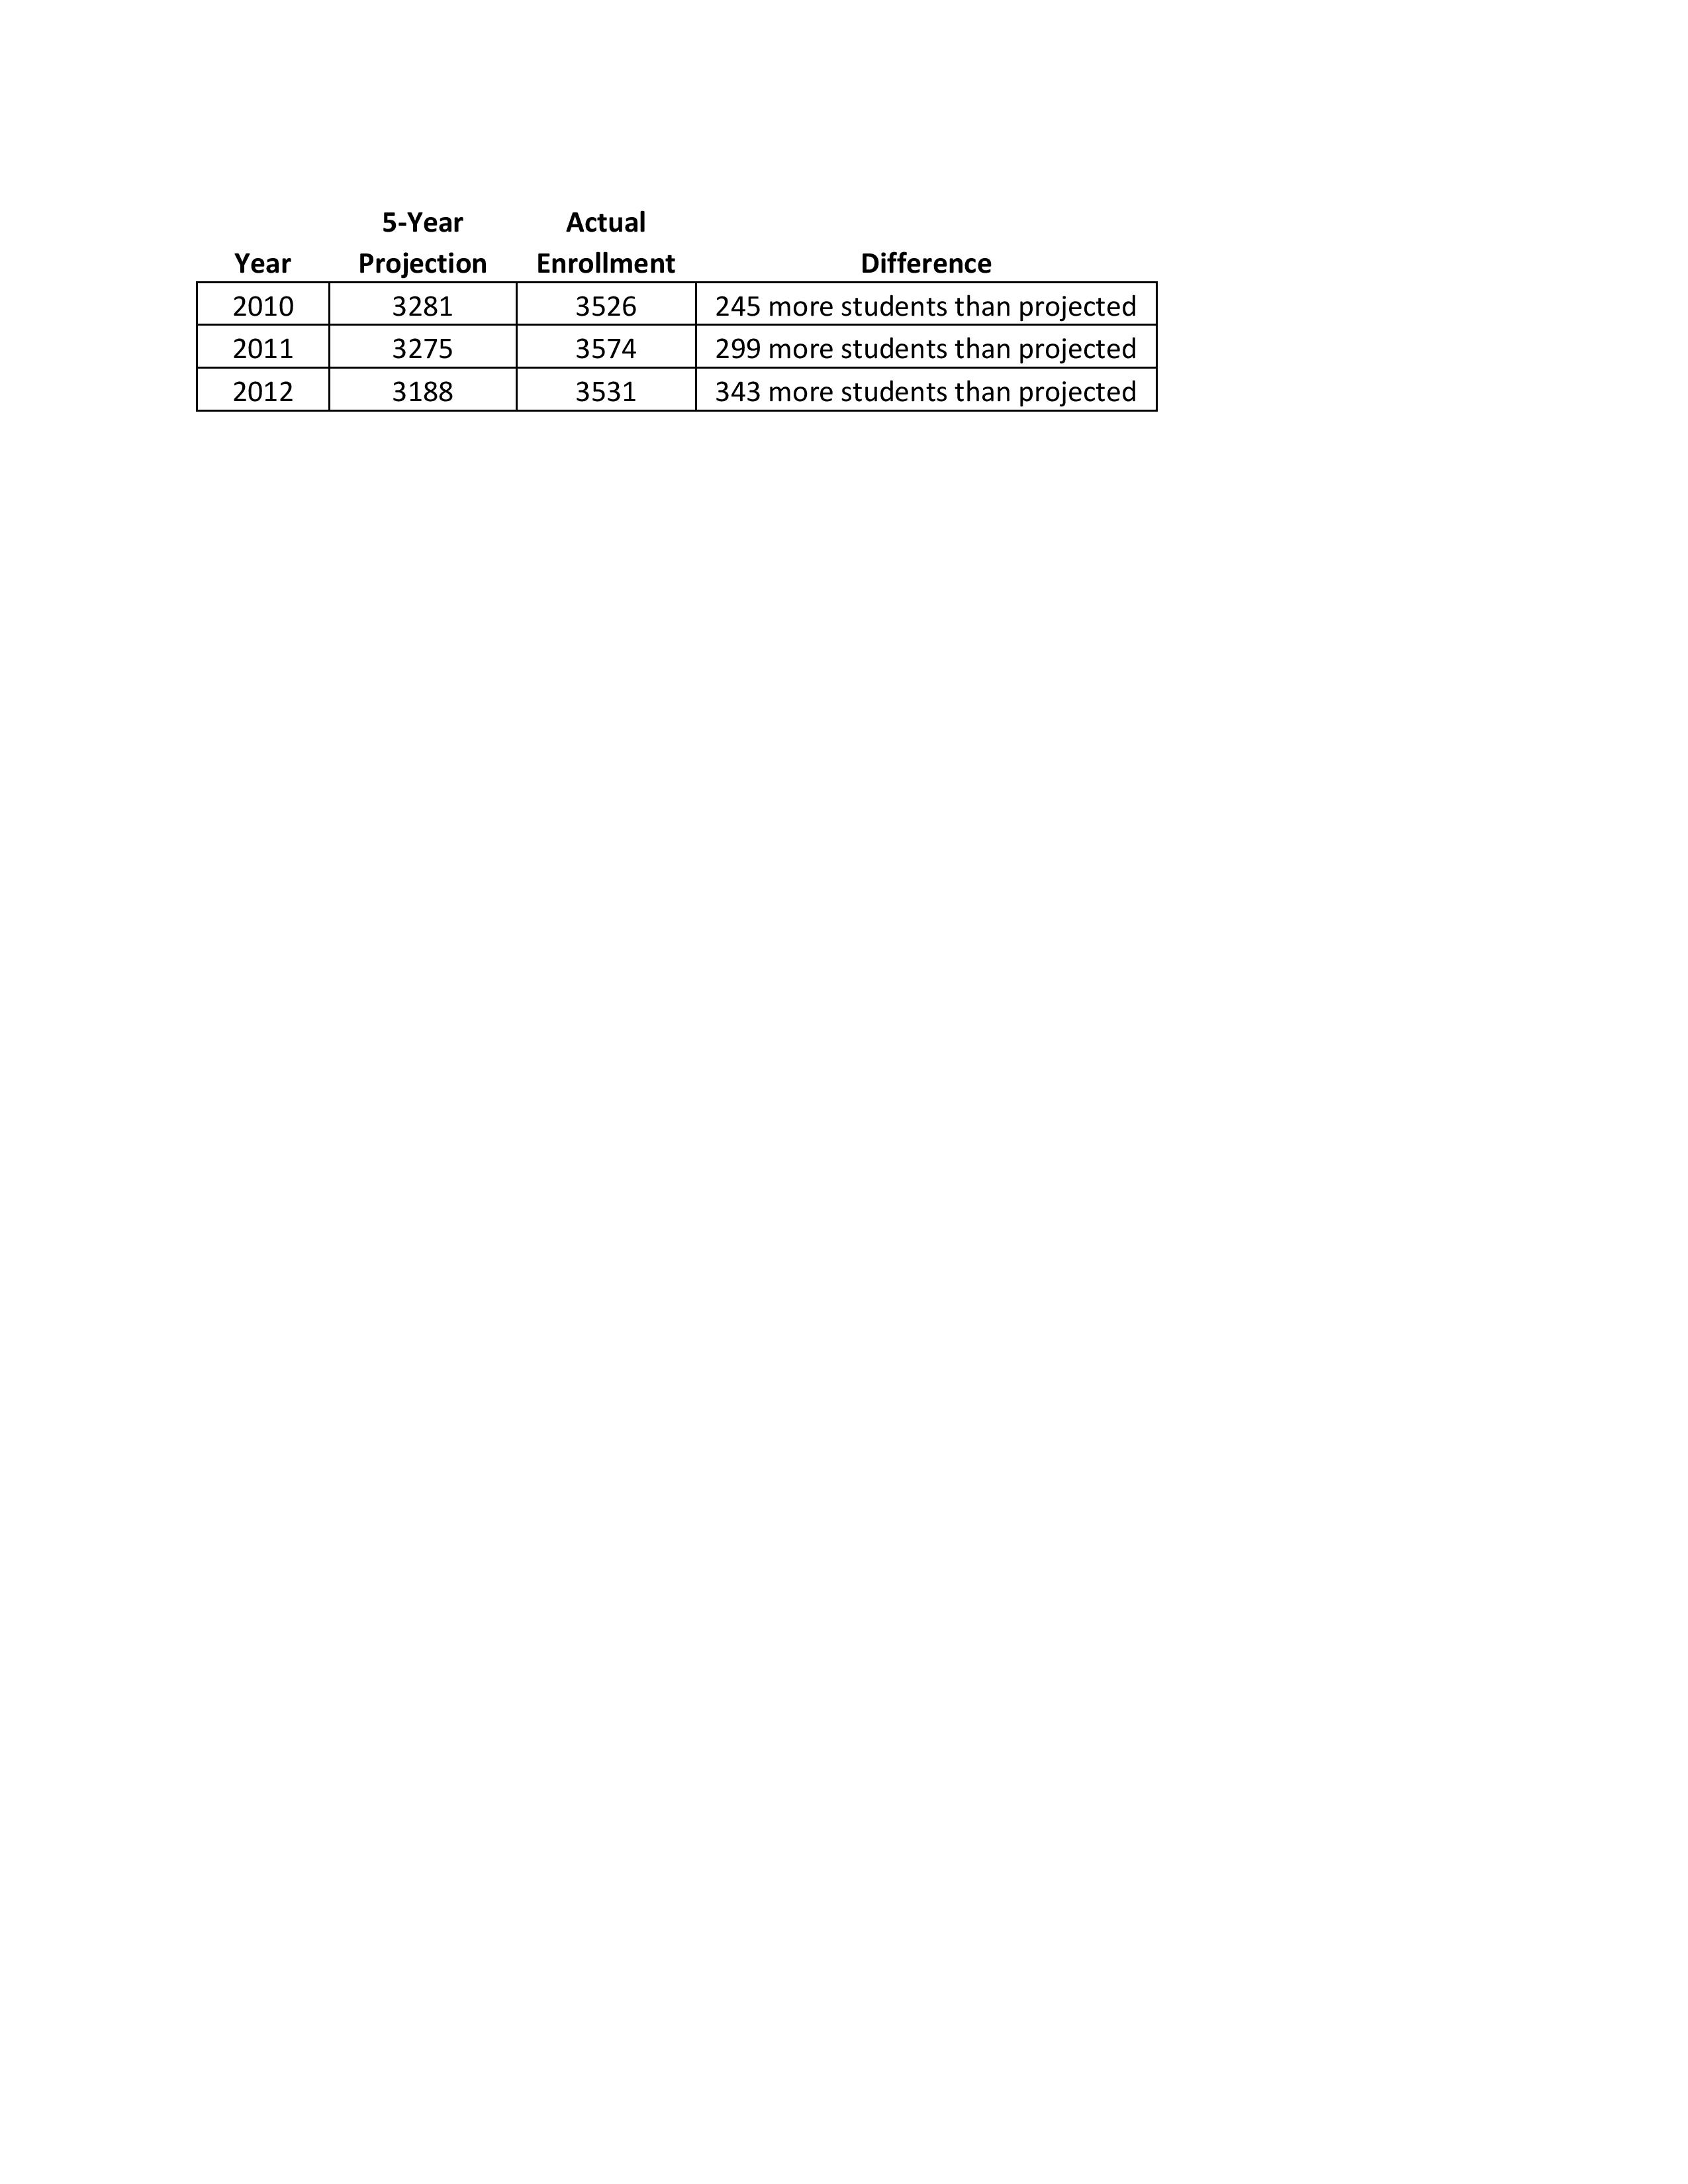
2010- 2011 Projected elementary enrollment = 3281

2010-2011 Actual elementary enrollment =3526

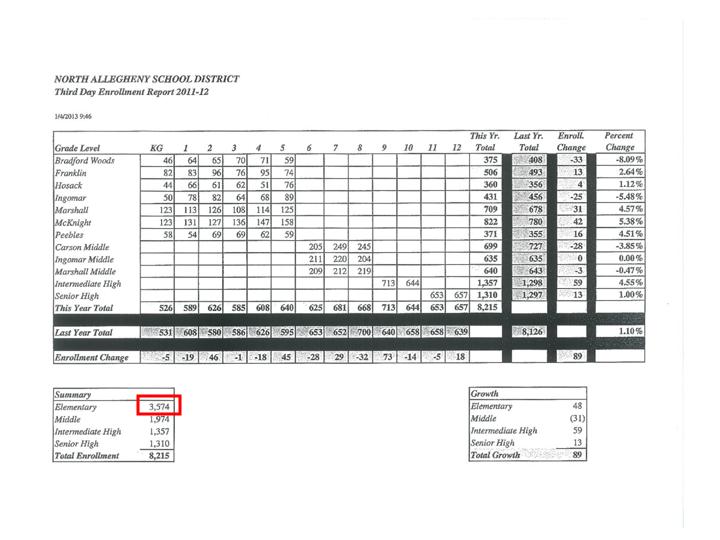
2011-2012 Projected elementary enrollment = 3275

2011-2012 Actual elementary enrollment = 3574
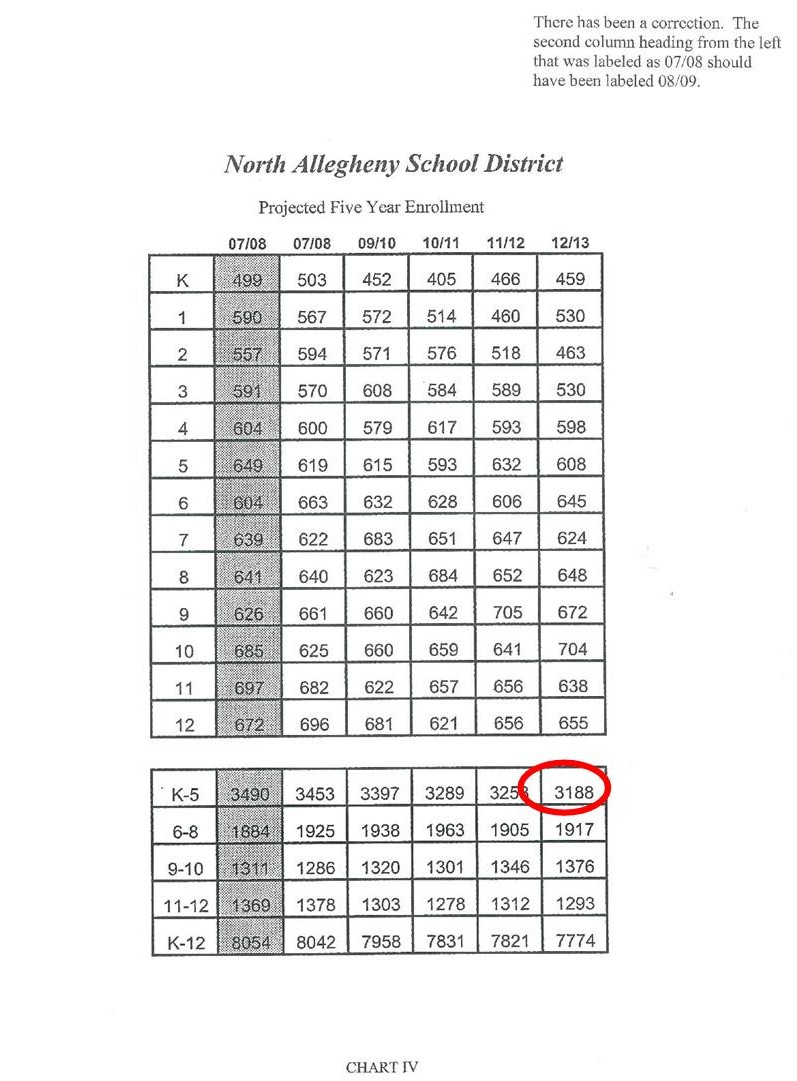
2012-2013 Projected elementary enrollment = 3188
2012-2013 Actual elementary enrollment = 3531

